As part of my work with some Akamai resellers in Latin America, I help improve their customers websites performance. This process not only includes doing an optimal CDN implementation, but also sometimes includes doing load and performance testing to take metrics and recommend improvements.
One of the open source tools we use for load testing is apache bech, a benchmarking tool that has been around for a long time. Apache bench is a simple tool that can help you have an initial idea of things like:
- Find out the amount of concurrent users a website can handle before response times start to spike up.
- How many concurrent connections (users) a website can handle before it stops responding .
- Help you do server dimensioning for an application.
- Test cloud infrastructure autoscaling.
Granted, there are other tools than apache bench (propietary and open source) that can emulate a user more realistically, but many of these open source tools alternatives lack an important feature in my opinion that is plotting the test results. These graphs can be an important complement and can show you things that are not that obvious looking at the text test results.
So I wrote a tool called ab_graph.sh that can help plotting apache bech results. This tool is basically a wrapper script that sets up the parameters to save the results for plotting (-g and -e options), and calls gnuplot with those files.
Here are all the configuration options:
Usage: $0 OPTIONS
OPTIONS:
-c Concurrent connections (default: 1)
-k Enable keepalive (defalt: no)
-E Extra parameters
-n Number of requests (default: 1)
-u Url to test (mandatory)
-h Print help.
-V Debug mode.
To use av_graph.sh Apache bench and gnuplot installed. Lests do an example. First clone the repository:
$ git clone https://github.com/juanluisbaptiste/apachebench-graphs
$ cd apachebecnh-graphs
If you were going to test the url www.testsite.com we could use the following command:
$ ./ab-graph.sh -u http://www.testsite.com -c 50 -n 1000 -k
That command will run an apache bench against www.testsite.com, sending 50 concurrent corrections until 1000 requests are sent. If you need to pass more parameters to apachebench you can use the -E option. Refer to apachebench documentation for more details. Results are stored with the following structure:
$PWD/results/www.testsite.com/2019-12-01-13-17/
Inside that directory you can find the following files:
- values.tsv and percentages.csv: apachebench results files for plotting.
- values.p and percentages.p: gnuplot files created using a template.
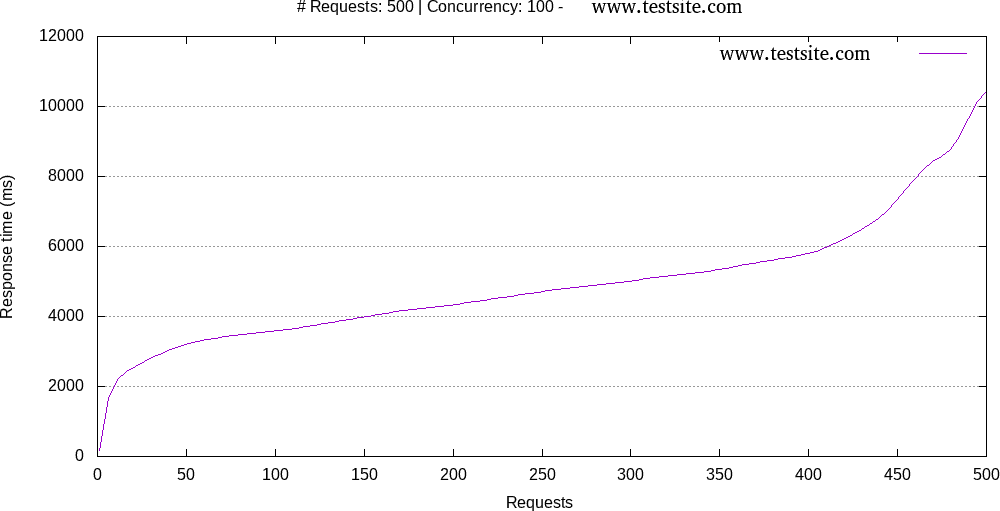
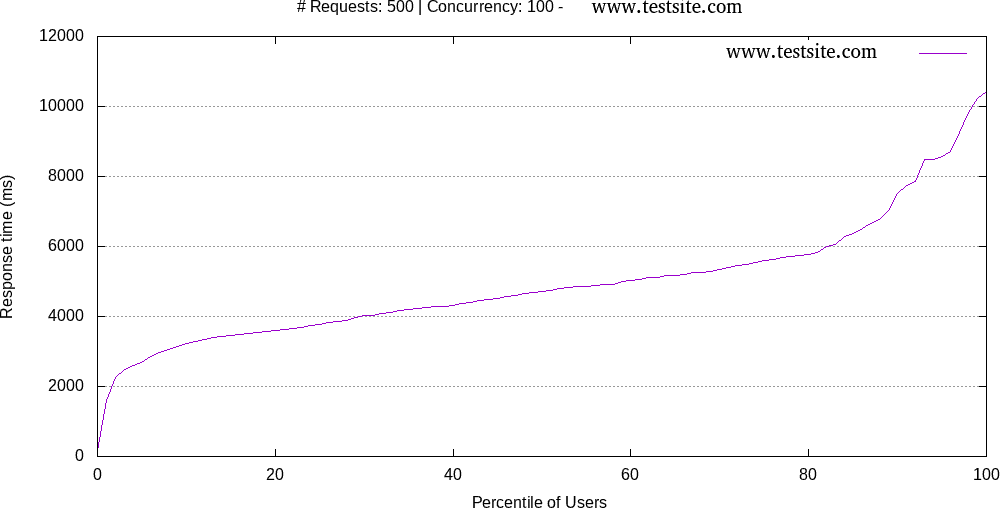
- values.tsv.png and percentages.csv.png: plotted results.
- summary.txt: apachebench summary results printed on the screen at the end of the test.
And these are the plotted results:
Values.tsv:
percentages.csv:
You can customize the resulting graphs by modifying the gnuplot templates found in the templates directory. This project is still in early development, so there may be some bugs that you can report at the repository issues page.
Comentarios recientes